Communication Channels & Messaging Distribution
As a social species we are constantly seeking out ways to connect and relate to each other. Emerging studies indicate that our mental and physical health rely heavily on the social interactions we have with each other. Take the following examples from Gallup[1]:

Gallup found that social activity increases your chances of having a good day.
Image: Gallup, Inc.
- People with fewer social ties have nearly twice the risk of dying from heart disease and are twice as likely to catch colds even though they are less likely to have the exposure to germs that comes from frequent social contact.
- The memories of people who are socially active decline at less than half the rate of those who are not.
According to a report in the New England Journal of Medicine (Christakis & Fowler, 2007)[2], social behavior is a significant factor contributing to the spread of obesity and that it’s spread can be quantified in patterns based on the nature of social interaction.
The study defined obesity as having a body-mass index (weight in kilograms divided by the square of the height in meters) of 30 or more, and that it is the product of voluntary choices or behaviors. Monitoring a total of 12,067 participants over the span of 32 years, between 1971 and 2003 in the city of Framingham, Massachusetts[3], the study found that social contagion increased an adult’s chance of becoming obese by:
- 57% if he or she had a mutual friend who was obese;
- 40% if he or she had a sibling who was obese; and
- 37% if he or she’s spouse was obese.
Gender and social distance also contributed to the spread of obesity. People of the same gender had a greater influence on each other than people of different genders. In the same way, people who had a closer social relationship had a greater influence on each other than people who simply lived near each other. This last point is important because it shows that environmental factors play less of a role in the spread of obesity than the amount and quality of social interactions.
After their study outlining the social spread of obesity, Christakis & Fowler continued their analysis of social networks with Connected: The Surprising Power of Our Social Networks & How They Shape Our Lives (2009)[4], suggesting that both our behaviors and perception of the behaviors of others are interconnected through a series of subtle communication channels that affect our emotional states and personal belief systems. Anyone who has been to an NFL tailgate or Holiday party can confirm experiencing a ‘culture’ of unhealthy behaviors that are difficult to overcome. This is especially true when we are with people who are significant to us; people we know and trust versus people in a commercial[5].
The Framingham study concluded that the social spread of obesity was not entirely due to an imitation of behaviors. This was determined in part because there was no correlation in the spread of specific behaviors such as smoking cessation or overeating and obesity. Instead, obesity is primarily spread through a slow social exchange: by changing people’s perception of social norms regarding acceptability of obesity and their own risk of illness.
Finally, the study argues that like the spread of obesity, social norms can be changed to promote the contagion of healthy behaviors. Approaching obesity as a public health problem instead of a clinical problem, creating wellness programs that encourage positive social interaction and quantifying the patterns of successful engagement are crucial to the social contagion of health.
I applied the role of social engagement and contagion to the Ballarat Wellness Study through program’s content concerning the “Engage It” Booster, overall content distribution, and an analysis of how participants used social engagement throughout the program. Because most of the study subjects were not overweight, I choose to focus engagement on creating positive relationships and healthy behaviors instead of weight loss specifically.
Content Strategy
“Engage It” is one of the 7 Body-Brain Boosters developed by Paul Taylor and Dr. Roy Sugarman to encourage a higher quality and quantity of social engagement. The Engage It Booster, formerly called the Befreind It booster, was the primary content theme on BallaratWellness.com for Week 6 of the study (Nov 5-11, 2012). Below is an example of and summary of Engage It-themed content:
8 posts were made on the blog specifically devoted to the Engage It Booster although other posts were tagged in the same blog category as Engage It because they were closely related in the nature of content.

Engage It! Content Sample.
As a content theme, the Engage It Page provides an overview of the Booster and a list of all posts specifically written with this Booster in mind. All content that is related in some way to the Engage It theme, although not necessarily written specifically for this Booster is found on the Engage it Category Page.
Some themes within the Engage It category were:
- Positive Engagement
- Communication for Leadership
- Effective Communication
- Condition Your Brain for Success
- Cultivating Happiness
- Building Mental Agility
Every week, I also shared a light-hearted post on BallaratWellness.com.
Some examples of these posts include:
Usually, the posts included a funny video and information about the importance of building positive friendships or simply laughing more. I had several goals for these posts, one of which was to include content that humanized the process of behavior change. Changing habits, tracking calorie intake and pivoting how we engage in our social networks can be extremely difficult and daunting. The initial health survey showed that a large number of participants tested positive for the first stage of depression, so I wanted to do whatever I could to solicit a smile or laugh into their work atmosphere even at the risk of discrediting the seriousness of this program.
The feedback I received from participants when asking them what their favorite posts of the program had been came back unanimously in favor of the light hearted videos. As one study subject put it in a weekly survey:
I’d forgotten to laugh… I’ve been so tired, stressed, busy & uptight that I’d forgotten how good it is to laugh till you cry. It probably sounds mental, but now I actively seek out a good laugh daily.
Using the communication tools covered in the Engage It and light-hearted posts, my hope was that participants would feel more confident and inspired to engage with each other and their social networks in a positive way.
Content Distribution Across Multiple Platforms
In addition to the BallaratWellness.com site, I encouraged social engagement on the Fitbit website and through a group Skype presentation.
On the Fitbit website, I became “friends” with 43 participants where being a friend meant that we would be able to share otherwise “private” stats about the activity levels, wellness goals, and diet listed on our Fitbit profiles. We were also able to “cheer” or “taunt” our friends by clicking an icon near a listing of my “friends” activity stats. We could also send each other private messages, post our activity accomplishments on Facebook and Twitter, or email each other the badges we had earned.

The Fitbit.com Dashboard shows me my activity levels of the day and allows me to easily see where my activity scores rank amongst my friends. I’m able to “Taunt” or “Cheer” friends easily by clicking an icon.
I also created the Ballarat Wellness private forum on the Fitbit site that 68 of the study participants have joined as a way to encourage conversation. I would often post interesting articles, links to the weekly online surveys, as well as links to new posts on BallaratWellness.com. Although there wasn’t much of a response from study subjects to the forum, traffic to BallaratWellness.com and would consistently spike after I posted a link there. I would also get more participants to take the weekly surveys if I linked to them in the forum and emailed the group, than if I only emailed the group with a link. This shows that while participants may not be adding new content, they are engaging in the content that is posted.
Between weeks 5 and 7 of the study, I encouraged participants to send me their weekly Fitbit activity reports that showed the daily average of steps taken. The Fitbit platforms automatically sets a goal for users to achieve 10,000 steps a day, but I didn’t make this number a major goal in the program’s content. 48% of participants sent me their Fitbit weekly reports via email at least once in the three weeks I had asked for them. The reports are emailed to the participants each week from Fitbit, need only be forwarded to me. Since less than half of the participants forwarded me these emails at least once in 3 weeks, I have concluded that email is not the best way to engage with participants in the study.

The Ballarat Wellness private Forum.
In week 4 of the study, some of the participants had organized a lunch meeting where I would be able to present some initial finding to the group via Skype. The participants who organized the meeting printed out fliers and sent emails to other participants. They reserved a conference room and arranged to have the City of Ballarat buy a healthy lunch for everyone who attended. 60 participants attended the meeting on October 31st, at noon in Ballarat (6pm, October 30th in San Francisco), and were seated in front of a large television monitor connected to a laptop to broadcast my Skype presentation. The laptop had a camera on it that was pointed to the group, so I could see them as I spoke.
My presentation included initial health stats from the SF36v2 health survey and a general outline of how people are engaging with BallarateWellness.com and the Fitbit site. I then opened the presentation up to questions. Many of the questions had to do with emails participants weren’t receiving about the program. As a result, I posted a banner on the BalaratWellness.com site that links to the most recent weekly survey on SurveyMonkey, and always include important updates to the Fitbit Forum. Social engagement with the site and survey participation spiked in the week following the meeting, but tapered back down in proceeding weeks.
Analysis of Social Engagement
My objective in analyzing the social engagement of study participants was to understand how social interactions affected participants’ wellness goals and which forms of communication were the most effective in spreading a dialogue about participants’ wellness goals.
While many people have Facebook and/or Twitter accounts, few choose to share about their wellness goals on these channels.
It’s important to note that I did not analyze what wellness goals were being spread or if the perception of these wellness goals was positive. My hope was that by engaging in a dialogue about health and goal setting at all will eventually change the perception of how important certain wellness related behaviors, such as staying active and eating whole foods, are to their own health.
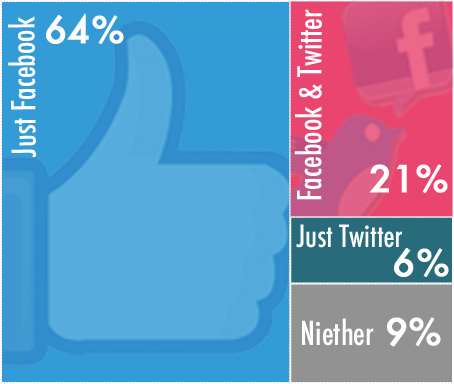
My first point of analysis was to measure how many participants used popular social media sites Facebook and Twitter. In the Week 6 survey, I asked the multiple choice question:
Do you have a Twitter and/or Facebook Account?
-
Just Facebook
-
Just Twitter
-
Facebook and Twitter
-
Neither
Although I had encouraged people to create their own Facebook groups or post their health behaviors on Twitter, I wondered if it would be beneficial to start a Ballarat Wellness private group on Facebook or create a Ballarat Wellness feed on Twitter. It was late in the program to start these groups, but if it encouraged success and engagement, it may be worth it.
62 of the 106 (or 58%) of the study subjects answered the question. As you can see from infographic, 64% of those who answered used only Facebook, where only 6% just used Twitter, and 21% used Twitter and Facebook.
Since 64% of 62 subjects is about 40, it did not make sense for me to spend a lot of time making a Facebook group in addition to the Fitbit forum, weekly emails, and daily BallaratWellness.com posts.

A snapshot of communication channels subjects used to discuss their wellness goals throughout the 7 week program.
To understand exactly how participants socialized their wellness goals through out the study, I asked participants the following question in every weekly survey:
Have you spoken about your wellness goal(s) with anyone this week (they do not have to be in the study)?
If so, what channel of communication did you use (example: face-to-face, email, phone, Facebook, etc)?
An average of 81 study subjects, or 76% of the total number of subjects, answered this question in the 7 weekly surveys it was asked. The range of subjects who completed their weekly surveys was 100 in Week 1 to 63 in Week 6.
By and large, the most popular communication channel was face-to-face conversation, although many of the participants listed multiple channels of communication.
The survey question itself was a bit vague. My goal was simply to measure how online engagement compared to face-to-face social engagement in a wellness program, but over 40% of subjects listed exactly who and how many people they interacted with through each communication channel. With this data, I was able to measure an estimated average of people that were reached by social interactions with participants each week.
Based on my analysis, participants interacted with an average of 2 or 3 people each week about their wellness goal. Most of those interactions were face-to-face, which makes sense since the majority of subjects work together. Other study subjects spoke with their running and weight watchers groups, personal trainers, family, friends, doctors and chiropractors.
Although most of the subjects spoke about their wellness goals through an in-person, verbal communication channel, the level of contagion was relatively low, yet significant. What I mean by this is that based on the number of people a subject reported having face-to-face communication with, social contagion only reached 1 or 2 people at a time. Yet, because face-to-face communication is the most personal and powerful form of communication that draws on subtle facial expressions and vocal intonations, those 1 or 2 people were more likely to be affected by the conversation and spread the wellness-related emotions, behaviors, and thoughts being transmitted.

Each study subject spoke to an average of 2 to 3 people each week through an array of communication channels.
Conversely, a study subject might post something about their wellness goal to the Fitbit Forum or their personal Facebook status that reaches an average of 10 people. This makes whatever messaging the subject is conveying about their wellness goals that much more contagious. However, the value of the communication channel is quite low and the 10 people who have been exposed to the message may not be as likely influenced.
Determining how many people each communication channel reaches and the value of that communication can be tricky. Nearly 40% of the study subjects listed exactly who they communicated with, which was a big help. For the others, I used whatever data I could find on each channel.
In the instance of Facebook, I found that the average number of friends a Facebook User has is 190[6], but that only 12%[7] of their friends will see a typical post. This means that the average Facebook uses reaches 23 people with their post, but what if they posted to a private group, a private message, or chat? I took the average of these variables to form a general number. Assuming that 5 people views a post to a private group, 1 person views a private message, 1 person views a private chat. The average of 23, 5, 1, and 1 is 10. Unless otherwise specified, Facebook’s distribution network is about 10.
The average Twitter user has 126 followers, yet 71% of tweets each day attract no reaction[8]. Therefore, only 29% of 126 followers, or 37 people will see any given Tweet when it is published. Again, people can send each other private messages or have a private account. I assumed that 4% of 126 followers or 5 people will view a tweet on a private account. One person will view a private tweet. The average of 37, 5, and 1 is about 14.
However, this is only in the first 15 minutes after a post has been tweeted before getting lost in the real-time feed. The time it takes for a tweet to get lost in a persons feed was too complicated for me to quantify. Since I am measuring the effectiveness of the communication channel, I lowered the amount average amount of people that see an tweet by an average user is 15% of the 126 followers or 19 people. The new average of 19, 5, and 1 is about 8. Unless otherwise specified, Twitter’s distribution network is about 8.
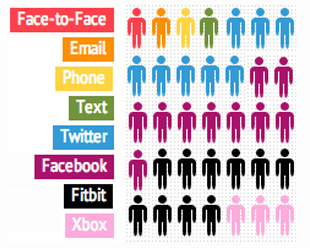
Network Distribution: the number of people that each communication channel reached.
Determining the value of Fitbit interactions is difficult since there are so many ways to interact. A few people posted to the Fitbit forum, but most of the interaction was private. However, because it is so easy to have private interactions on Fitbit the number of actual interactions could be quite high. There was no way for me to measure this unless it was specified specifically by a subject in the surveys.
The Fitbit Forum has 68 members, many of whom hide their names from their profiles and are unlikely to interact with others. I guessed that because people are encouraged to interact with each other in the program the value of a Fitbit interaction would be the same as Facebooks: 10.
Xbox interaction was even more difficult to estimate since there was only one subject who used it as a communication channel and did not specify in what context the interaction took place. My guess was that Xbox was less than any other channel but more than 1 since there is a chance that the interaction could have happened in a group chat. The value I chose was 3.
Determining each channel’s distribution network was easier than quantifying the value of each channel. Yet, simply knowing that there are proportionate differences between channels is crucial to understanding how each channel was used by the subjects. to do this, I assigned each communication channel a value on a scale of 1-100. There is no way for me to tell the value of communication channel based on my research for this study. However, because Face-to-Face communication is often a bilateral form of communication that involves critical thinking and the subtleties of facial expression and vocal intonations from both parties, it is assumed to be a more effective form of communication for the expression of emotions and perceptions of health compared to Facebook. Below is how I determined the value of each communication channel.

The comparative value of each channel it it’s ability to transmit thoughts, emotions, and perceptions.
Face-to-Face: 100
Bilateral communication, reliant on facial expressions and social cues.
Phone: 90
Bilateral communication and social cues, vocal intonations to express emotion. No facial expressions.
Email: 80
Can be bilateral eventually, but allows people to fulling express their thoughts before opening to the other’s response. No facial expressions or social cues.
Text SMS: 70
Immediate, short hand communication that may or may not be bilateral. No vocal intonations or facial expressions. A surprisingly effective use of social cues to convey emotion, context, and meaning.
Twitter: 30
Immediate, rarely bilateral communication, often too public for meaningful conversation. No vocal intonations or facial expressions. Like Text SMS, surprisingly effective use of social cues to convey emotion, context, and meaning.
Facebook: 40
Immediate, short hand communication that may or may not be bilateral. No vocal intonations or facial expressions. Most communications focus on the clicking of a “like” button. Users feel more accomplished with the more likes they have. It’s unclear how effective these social “points” affect behavior change or if they offer the support needed in a social wellness program. By being so public, it may be extremely effective in creating a sense of accountability for the user posting.
Fitbit: 20
Immediate, short hand communication that may or may not be bilateral. No vocal intonations or facial expressions. Most communications focus on the clicking of a “cheer” or “taunt” button that generates a badge-like icon on other users screens. It’s unclear how effective these social driven badges in conveying the support needed in a social wellness program.
Xbox: 10
Immediate, often too public for meaningful conversation. No vocal intonations or facial expressions. Conversation occurs in a gaming setting, where meaningful conversation is not common. Effective use of social cues to convey emotion, context, and meaning.
With this data, I noticed an interesting trend in social engagement. The level of contagion was higher in the first week of the program. This is not reflected in the amount of people that subjects spoke to about their wellness goals, but who they spoke to. Subjects told more people who were not in the program about their wellness goals in the first 2 weeks of the program than in the weeks that followed. As the program progressed, study subjects mostly socialized outside of the program if they were “making progress” toward their wellness goal(s). Subjects who primarily communicated with their spouses or others in the program tended to struggle in meeting their wellness goals. This may have more to do with subjects relying on the support others with similar wellness can offer than being ashamed or afraid to share their struggles with people outside of the study.
Detailed Weekly Analysis
WEEK 1
- 100 subjects completed the survey
- 86 subjects socialized about their wellness goals with an estimated 180 people.
- Some of the subjects socialized with each other or the same people, which may decrease the estimate of 180 people who were socialized with.
- On average, subjects socialized with 2 people
WEEK 2
- 87 subjects completed the survey
- 54 subjects study socialized about their wellness goals with an estimated 190 people (see note from week 1)
- On average, subjects socialized with 3 to 4 people.
WEEK 3
- 90 subjects completed the survey
- 76 subjects study socialized about their wellness goals with an estimated 215 people (see note from week 1)
- On average, subjects socialized with 3 people.
WEEK 4
- 80 subjects completed the survey
- 73 subjects study socialized about their wellness goals with an estimated 181 people (see note from week 1)
- On average, subjects socialized with 2 or 3 people.
- 60 subjects attended the lunch break Skype presentation
WEEK 5
- 79 subjects completed the survey
- 73 subjects study socialized about their wellness goals with an estimated 181 people (see note from week 1)
- On average, subjects socialized with 2 or 3 people.
- 60 subjects attended the lunch break Skype presentation
WEEK 6
- 63 subjects completed the survey
- 48 subjects study socialized about their wellness goals with an estimated 145 people (see note from week 1)
- On average, subjects socialized with 3 people.
WEEK 7
- 73 subjects completed the survey
- 57 subjects study socialized about their wellness goals with an estimated 118 people (see note from week 1)
- On average, subjects socialized with 2 people.

References:
1 Rath, T., & Harter, J. (2012) Your Friends and Your Social Wellbeing. Gallup Business Journal. Retrieved from http://businessjournal.gallup.com/content/127043/Friends-Social-Wellbeing.aspx#2
2 Christakis, N. A., & Fowler, J.H. (2007) The Spread of Obseity in a Large Social Network over 32 Years. The New England Journal of Medicine, 357 (4). Retrieved from http://www.nejm.org
3 Coincidentally, Ballarat has a similar population and proximity to an urban area as Framingham: Melbourne for Ballarat and Boston for Framingham.
4 Christakis, N. A., & Fowler, J.H. (2009) Connected: The surprising power of our social networks and how they shape our lives — how your friends’ friends’ friends affect everything you feel, think, and do. New York, NY: Hachette Book Group.
5 For more about Connected and the Framingham study, please see this Engage It post on BallaratWellness.com.
6 Backstrom, L. (November 22, 2011) Anatomy of Facebook. Facebook. Retrieved from http://www.facebook.com/notes/facebook-data-team/anatomy-of-facebook/10150388519243859
7 Constine, J. (February 29, 2012) Your average Facebook post only reaches 12% of your friends. TechCrunch. Retrieved from http://techcrunch.com/2012/02/29/facebook-post-reach-16-friends/
8 Pring, C. (May 10, 2012) 99 new social media stats for 2012. The Social Skinny. Retrieved from http://thesocialskinny.com/99-new-social-media-stats-for-2012/


This Document is a Master’s Project which has been prepared at the request of and in connection with the University of San Francisco Sport Management Program. Neither this Master’s Project nor any of the information contained therein may be reproduced or disclosed to any person under any circumstances without the express written permission of Mae Schultz.